The Art of Evaluating Art Using Stock Chart Patterns

Evaluate Artworks
Before They Are Evaluated By The Pros
By: Lou Liu – Tech & Finance
Ever notice the barely audible whispers among hedge fund managers and other financiers who happen to be present at gallery receptions, auctions, or the various Art-Basel-type venues? You are not imagining things. All those hushes and nods are the subtle signs of byzantine methods at work: that mysterious and often tricky process of divination known in the trades as Technical Analysis – otherwise referred to as reading chart patterns.
Whether it is choosing equities or very pricey works of “cutting edge art,” savvy buyers are always aware of the underlying fundamentals and sentiment for that specific stock or work that might affect their investment in the long term. But being familiar with patterns gives the astute collector another important tool to work with.
Our persistent team of art sleuths has picked up subtle hints by observing certain regular investors at the art marts mentioned above. Our highly sophisticated analysts are so good, however, that they don’t even need to be present in order to venture wild guesses as to the eventual sale price of an artwork – or if it will sell at all.
The reason is that they are all former financial “industry” employees who have decided to put their highly lucrative trading skills into a much more modest earning field, such as making spurious predictions, but without the use of a crystal ball. It is a fascinating field that is rarely spoken about, let alone taught within the walls of art schools.
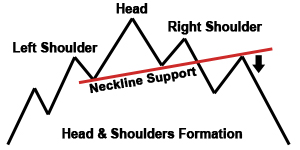
The art of reading stock charts is based on learning to recognize patterns. One common formation is called a “Head and Shoulders.”

In addition to the Head and Shoulders formation depicted above, which is usually “bearish”, there are many other frequently occurring patterns, which often come with catchy names, such as Double Tops, Cup with Saucer, Flags, Diamonds, and the sexy-sounding Rising Wedge, to mention a few. It is important to note that most patterns can have the same name but can bearish or bullish depending on whether they are inverted or not.
The skilled chart reader aims to “have an edge,” as the saying goes in the markets. And the folks with the big bucks who are purchasing artworks worth the big bucks don’t fool around. They do their homework and seek to gain every edge they can buy – hence the saying “edging out the competition.” Thus the energetic investor will analyze a potential purchase from all angles. And we mean angles…literally. This is where being able to recognize and analyze chart-type formations on works of art comes into play – at least among the Big Boys and Girls.
As a thing is viewed, so it appears.
~ Padmasambhava
According to some experts of questionable authority, the history of imagining and utilizing perceived formations for the purposes of investment or speculative trading can be traced as far back as the Neolithic Age. But we may delve further into that topic in a future article.
For now, suffice it to say that apart from the value estimates offered by “specialists” in the art market, there may be other reasons that particular Van Gogh, Modigliani, or Basquiat went for more money than the artists ever saw in their lifetime, let alone imagined – reasons that can only be discerned using technical divination. Formations in traditional art are usually more distinct than those occurring in contemporary or abstract works. But with practice and a keen eye, one may become quite proficient in spotting the hidden chart formations. And with a wild imagination, one can deduce rather quickly if the work in question will have any lasting monetary value. And isn’t that what art collecting is really all about?

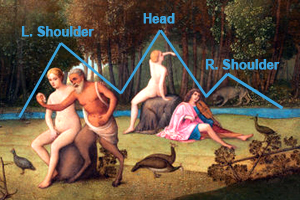
In the adjoining example, we see an oldish type painting showing some strange characters who seem completely detached from each other, let alone reality–much like many politicians. When we overlay a few support and resistance lines onto the painting, we can easily make out a possible Head and Shoulders formation at play. This is the dominant pattern for this work. With practice, however, one may be able to discern not only the dominant chart pattern that a painting or sculpture may offer, but also other patterns within the larger patterns that may be present simultaneously – adding to the fun.
A quick analysis of the pattern shown in the image above presages a possible settling of value at the stream level or perhaps at the lower peacock level. Either way, it would be more advantageous if the Head and Shoulders were inverted, which would portent an increase in price. And although we make no predictions, this clue suggests that it might be more judicious to hang the painting upside down (an inverted Head and Shoulders) in order to realize its maximum investment potential.
Once you delve deeper into analyzing artworks using imagined formations, you may notice at the next opening or art fair you attend that the artwork on exhibit, and perhaps even the people present, take on a whole new dimension – one you may not have encountered before. Of course, we strongly recommend you resist the urge to pull out your handy ruler and pen and start drawing patterns, along with Support and Resistance lines, on the artworks themselves, or on the guests for that matter.
As a side note, the drawing of actual charting lines on artwork was the surreptitious technique of the infamous early 20th-century Austrian art trader, Axel Hauser. Herr Hauser left his mark on many an artwork, only to cost museums and galleries enormous sums of money to have them cleaned up and restored to their pre-analyzed condition. For a time, Axel did very well predicting art values for his clientèle but was put out of commission when the law finally caught up with him in a pastry shop at the outskirts of the southern town of Leibnitz. As he was being torn away from his plate of Linzerschnitte and coffee by the gendarmes, he was heard crying out, “Support Resistance!” At the time, people thought he was merely shouting anarchist slogans.
But we know better.
♦
Editor’s Note:
It is not within the scope of this article to describe the many-faceted aspects of technical analysis. You may study up on that on your own, as there are plenty of free resources on the Internet. This series of articles on the Investopedia website would be a good place to start.


