The Art Of Stock Chart Pattern Recognition In Nature
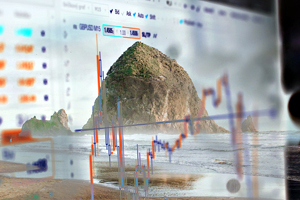
A New Way of Viewing the World Around Us
By: Lou Liu – Tech & Finance
As revealed in a previous article, stock chart patterns can be quite useful in determining the saleability and/or value of an artwork. We here at Art Twerks would be remiss if we didn’t follow up on that subject with an equally irrelevant article on spotting chart patterns in nature or the urban environment so as to avoid any unnecessary detriments to our well-being.
Currently, an ideological debate rages over the causes of global warming, even as evidence of climate change is manifesting throughout the planet. One might liken this unusual situation to a house that is burning while people argue as to whether the fire was caused by an accident or deliberate arson. Sane heads would follow the procedures adopted by professional fire departments around the world: first put out the fire and then do the investigating, or arguing, as it were. Unless, of course, there are other motivations involved.
In the spirit of fair play, we feel obligated to mention that an opposing school of thought believes that the climate will actually get colder, not warmer. In anticipation of this, more and more icebergs are headed toward the warmer regions of the planet that will soon freeze up. That’ll show those silly global warming elitists.

The recent trend of rising temperatures around the globe appears to be producing ever-growing herds of runaway icebergs from their arctic and antarctic homes. Imagine the turmoil that would be caused by gangs of unruly juvenile delinquent icebergs blocking up the entrance to New York Harbor or as far south as Miami! That would surely put a damper on all the alcohol-fueled cruises originating from those ports. Icebergs can develop into a variety of shapes, and although some of them can be deceivingly beautiful, you surely wouldn’t want your vessel running into one of them.
A couple of our in-house non-scientist speculators have put forth the theory that the warming phenomenon may actually be due to the overabundance of hot air being emitted from various legislative chambers. Regardless, it has become obvious that it is even more imperative that those who sail the high seas would do well to familiarize themselves with the basics on how to identify and avoid said relocating icebergs.
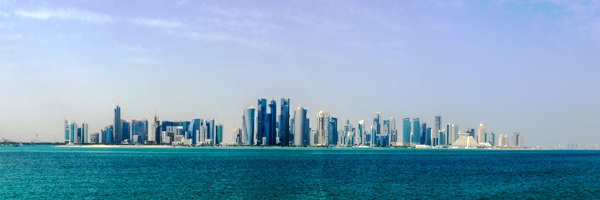
The image above depicts something similar to one of those newfangled floating cities we’ve heard is being planned for wealthy tourists of the future. Unlike icebergs, these new floatables tend to prefer warmer climes. Similar to analyzing a natural landscape with mountains and valleys, one needs to take into account one’s vantage point, i.e., where one is standing in relation to the subject. With urban landscapes, the task becomes more complex and trickier when you factor in all the unusual architectural features, such as twisted structures, faux Mayan temples, phallic shapes, etc.
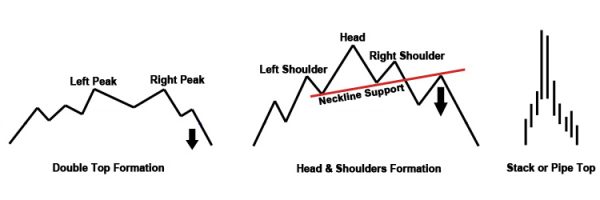
Illustrated below are just a few of the more common, in this case, “bearish,” formations that one may encounter in nature or the urban landscape. To reiterate what we mentioned in the first article regarding chart patterns when you find them in an inverted position, they represent a “bullish,” or rising situation. For example, if you were to spot an upside-down Head and Shoulders pattern in a landscape, that would inform you that you may be looking at a valley, or that the field before you is collapsing, in which case you’d better make a run for it. To illustrate the importance of being familiar with the interrelation that stock-chart patterns can have in our daily lives, a somber reminder comes to us from one of our highly proficient Chart Hounds, who likes to go by the name of “Zorch.” Natural pattern analysis shows that it may have been possible for the ill-fated ship, the Titanic, to have avoided being ill-fated. Yes, that’s right. Although highly improbable, due to weather conditions attributed to fog or a climatic optical illusion, had her captain and lookouts been taught even the most rudimentary skills in the marvelous art of chart pattern detection and interpretation, disaster might have been averted and that ship might still be floating to this day. Well, maybe not that long, but you get the idea.
What our intrepid Chart Hound noticed is a very striking resemblance between the two alleged iceberg suspects likely encountered by the Titanic and the specific chart patterns they most closely resemble visually.

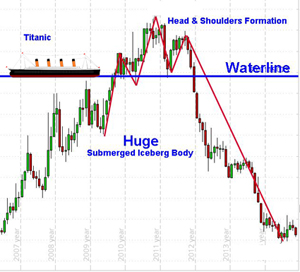
The images shown below are photographs of the two suspects that were spotted in the vicinity of the Titanic‘s last known coordinates before she sank. These two iceberg formations clearly resemble two of the most common stock-chart patterns. On the left is a rather shallow Double Top, while on the right we see an obvious Head and Shoulders pattern – both bearish patterns indicating sinking prices, or ships as the case may be. The image below depicts a commonly traded iceberg stock (market symbol: YIKES). We have added some support and resistance lines (in red) to make the pattern easier to discern. The blue horizontal line represents the support level. One can clearly see the danger icebergs, or their smaller derivatives, can pose to an unsuspecting ship, or investor, that is unfamiliar with stock-chart patterns. In the case of the Titanic, we know how that ended.
We want to point out here that, should you desire to pursue them, icebergs and mountainous landscapes, or artworks containing such objects, make for excellent subjects on which to practice technical analysis. Portraits, however, present a most perplexing predicament due to the fact that they are almost always Head and Shoulder formations. One may occasionally come across other, more unusual, formations in a portrait but they are most often associated with certain types of politicians and celebrities of dubious repute that are best avoided altogether.
In conclusion, we leave you, dear astute reader, with the question: Is it possible then that chart patterns in nature have the same influence they do in the markets? That is, can they be just as untrustworthy? That’s where the art of deciphering stock-chart patterns comes in. And if you happen to be an iceberg tracker, you should be busier than ever now, with all the melting ice around the world. On that note, we wish you good luck and happy hunting.


